Psychology
Same strategy. Fewer mistakes.
Write the rules you trade by, tick any you break when you log a trade, and see exactly what each one has cost you.
See it work
What your mistakes actually cost.
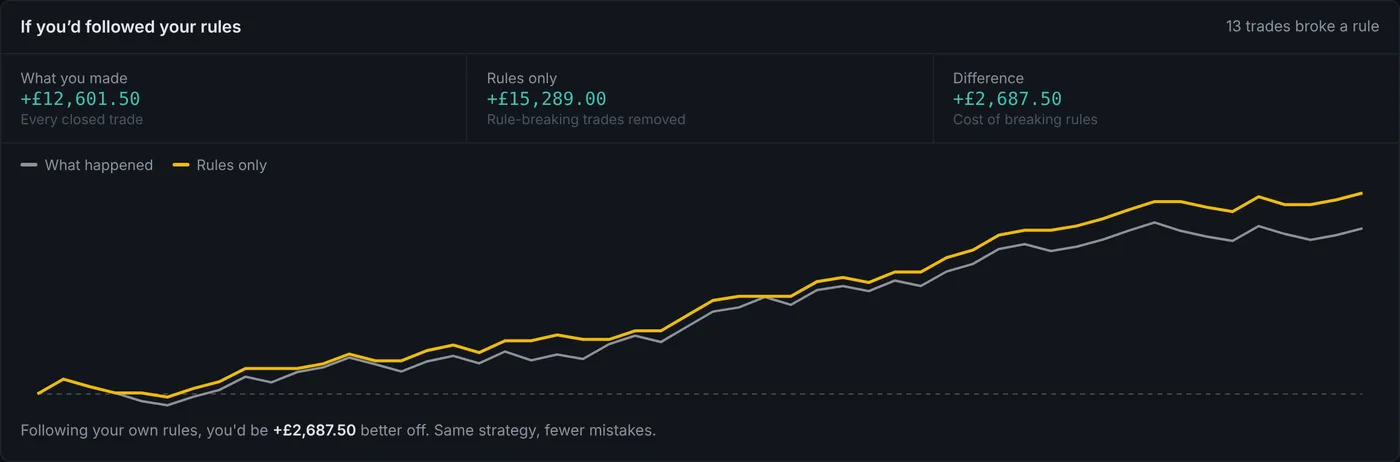
The grey line is what happened. The amber line is the same trades with every rule-breaking one taken out.
Costliest rule: Don't move your stop to breakeven · 5 times · −£1,940
Example data. Keep scrolling to play it, scroll back to rewind.
What it does
Rules and discipline, in four parts.
Every rule, measured
Times broken, net P/L on those trades and when you last broke it.
If you'd followed your rules
Your real equity curve next to the one without the rule-breaking trades.
Suggested from your stats
Rules worth adding, based on where you lose money, with a "not for me" option.
Worth a rethink
Rules you break often that are actually making money get flagged for a second look.
How it works
Three steps. That's it.
- 1Write your rules once.
- 2Tick any you broke when you log a trade.
- 3Check Discipline in Analytics to see what each one costs.
Works with
It's better connected.
Everything in TraderTracked reads from the same trade log, so each part makes the others smarter.
The strategy was always there.
Built by a trader, for traders. Same strategy, fewer mistakes.
Start free for 30 days