Review
Every day, colour-coded.
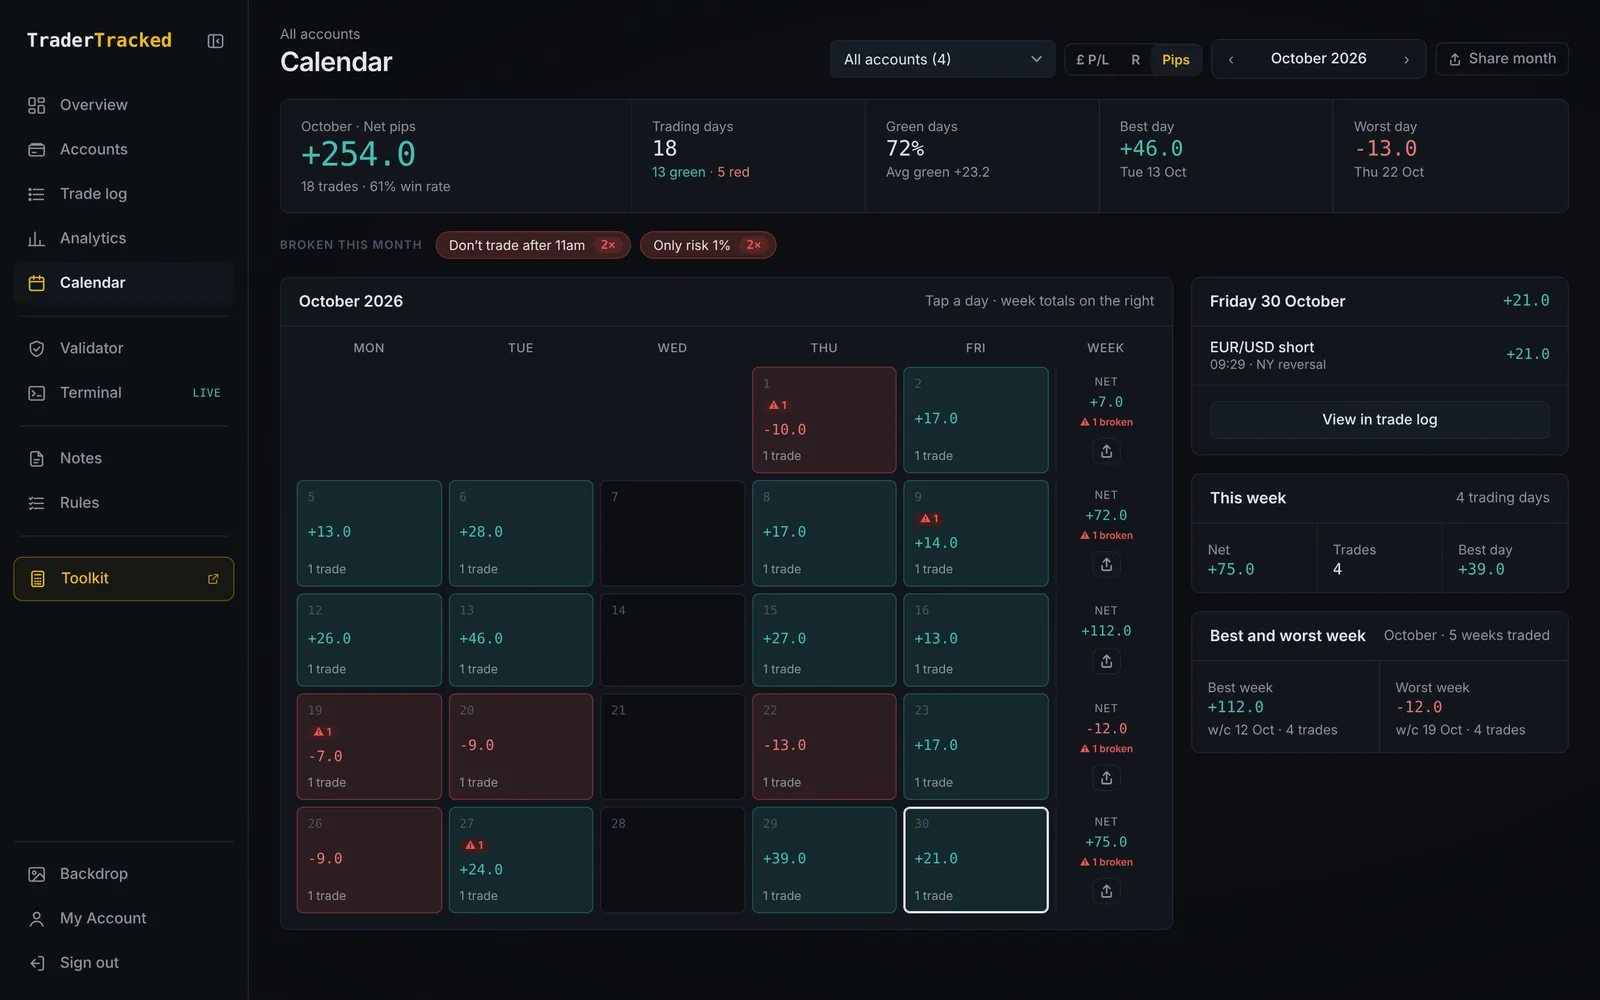
Your month at a glance in money, R or pips, with the day you pick, the week around it and your best and worst weeks beside it.
See it work
Your month, day by day.
Each trading day fills in as the month goes. The best and worst weeks pick themselves out.
Best week 13–17 Oct · worst week 20–24 Oct
Example data. Keep scrolling to play it, scroll back to rewind.
What it does
Calendar, in four parts.
Month view
Green and red days with the total for each, in money, R or pips.
Day and week detail
Click a day for its trades, with this week and the best and worst week underneath.
Rule breaks counted
See which weeks and months you broke rules in, not just whether they were green.
Share a month
Turn any month into a recap card in a couple of clicks.
How it works
Three steps. That's it.
- 1Open the calendar on any month.
- 2Click a day to see its trades and the week around it.
- 3Jump to that day in the trade log for the full detail.
Works with
It's better connected.
Everything in TraderTracked reads from the same trade log, so each part makes the others smarter.
The strategy was always there.
Built by a trader, for traders. Same strategy, fewer mistakes.
Start free for 30 days