After the trade
The same trades, asked harder questions.
Your numbers broken down the way traders think about them: by pair, setup, session and day, with the best and worst of everything at the top.
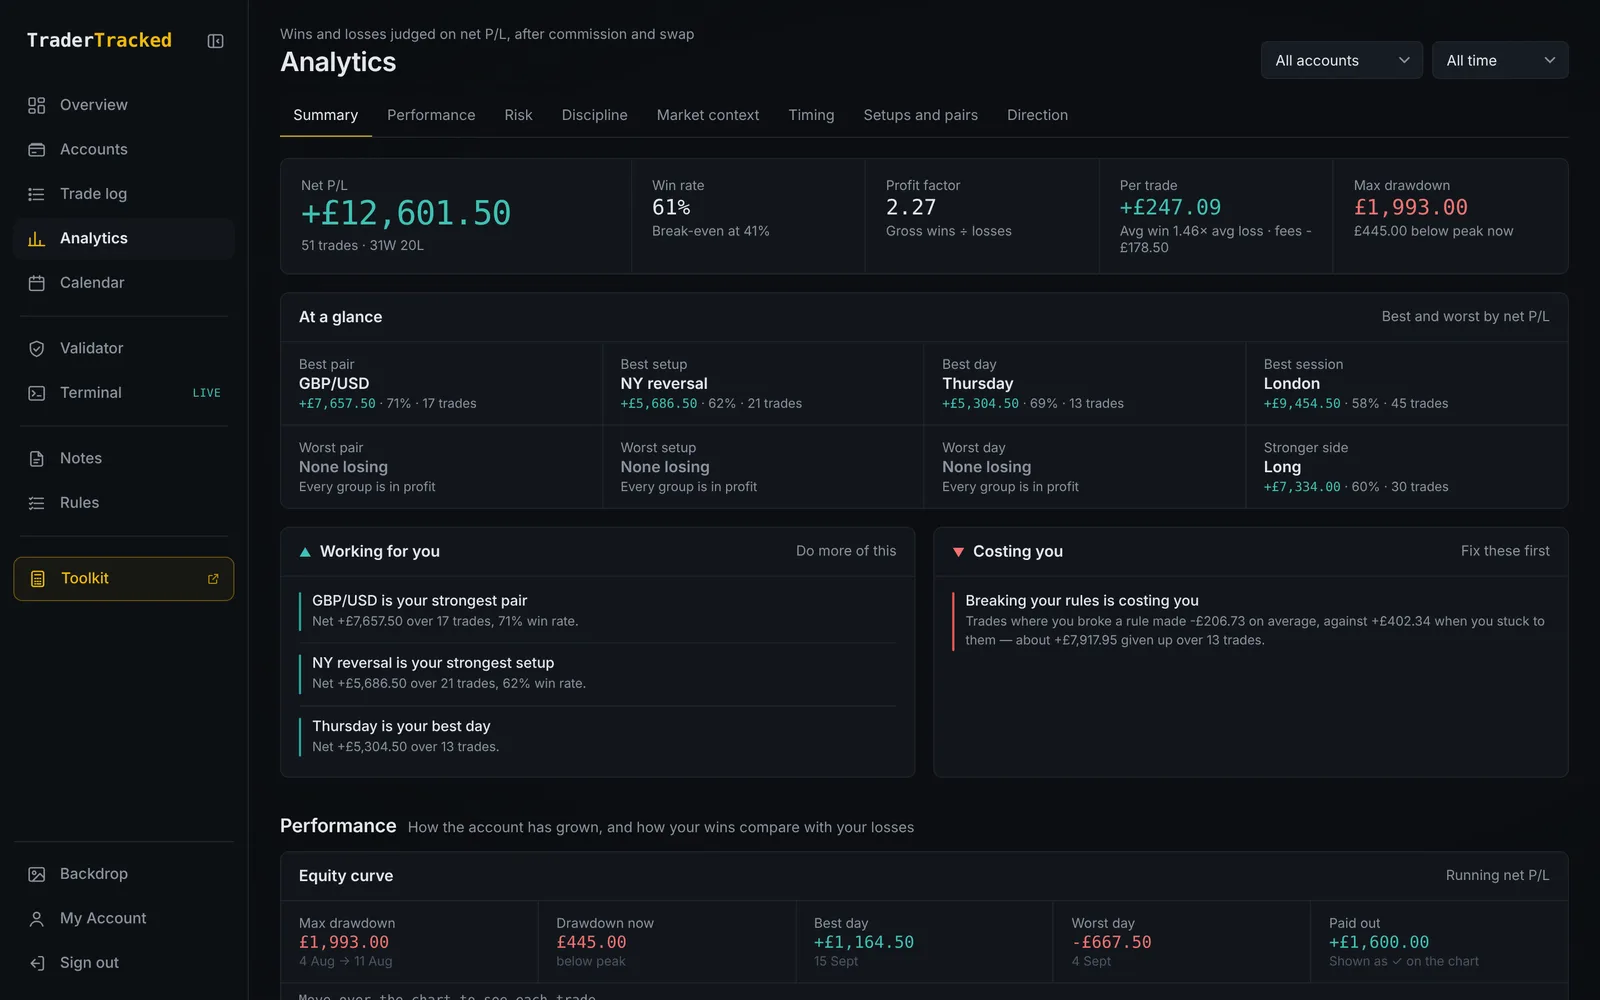
See it work
Where the edge is, in seconds.
The same trades, sorted the ways traders actually think about them.
Costing you: Asia session trades have lost £852 over 9 trades. London is where your edge is.
Example data. Keep scrolling to play it, scroll back to rewind.
What it does
Analytics, in four parts.
At a glance
Best and worst pair, setup, day and session, and your stronger side, from your very first trade.
Working for you, costing you
The patterns that are making and losing you money, in plain sentences.
Performance and risk
Equity curve with payouts marked, month by month, win versus loss, and drawdown by week or month.
Timing and setups
Days, sessions and hold times, plus every setup and pair ranked by net P/L.
How it works
Three steps. That's it.
- 1Pick an account and a time period.
- 2Read the summary first, then jump to any section from the tabs.
- 3Under 30 trades it says it is an early read, so you know how much to trust it.
Works with
It's better connected.
Everything in TraderTracked reads from the same trade log, so each part makes the others smarter.
The strategy was always there.
Built by a trader, for traders. Same strategy, fewer mistakes.
Start free for 30 days